Appearance
The most important aspect of using DeepSource is to manage and fix the various issues and metrics detected by analysis runs. We make this process easier by having all the details of a repository's analysis available in one place.
Once you click on an active repository, you'll be taken to the analysis information page for that repository, which contains everything (in various tabs) you need to know about it.
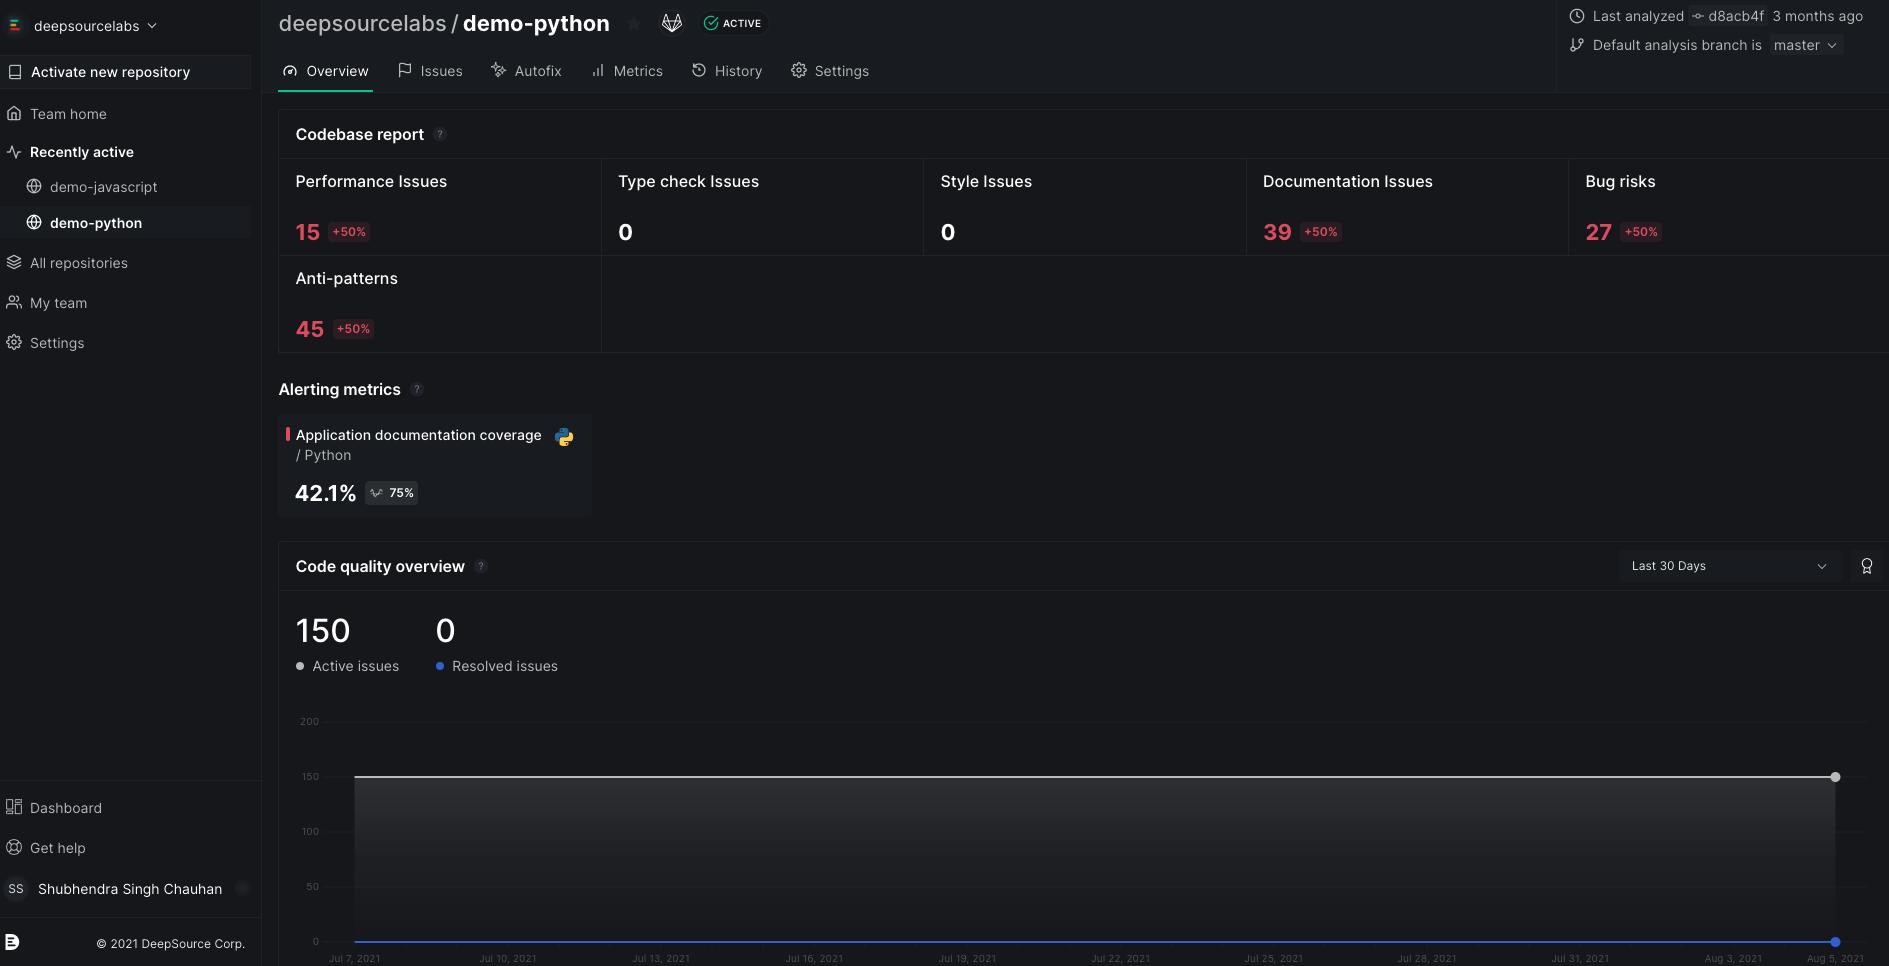
The Overview tab
Codebase report
In the Repository Dashboard, under the Overview tab (selected by default) top-most section is the Codebase report. It shows you a summary of the overall health of your codebase.
For detailed information on each particular issue and issue category, see the Issues tab.

Alerting metrics
The Alerting metrics show the most important code quality metrics that you should pay attention to. These are the ones that are below your set threshold value.
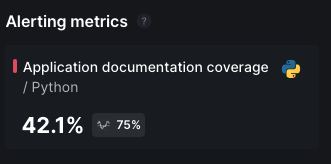
For details about all the metrics and their exact trends, see the Metrics tab.
Code quality overview
The Code quality overview plot is a graphical representation of the number of new issues active and the new issues resolved, per day.
You can toggle the duration of the plot to be 30, 60 or 90 days. On hovering over the plot, you can see the exact number of new issues which are active or resolved on each day.
This plot only shows the total active issues on the days when there was some activity on the repo

Recent runs
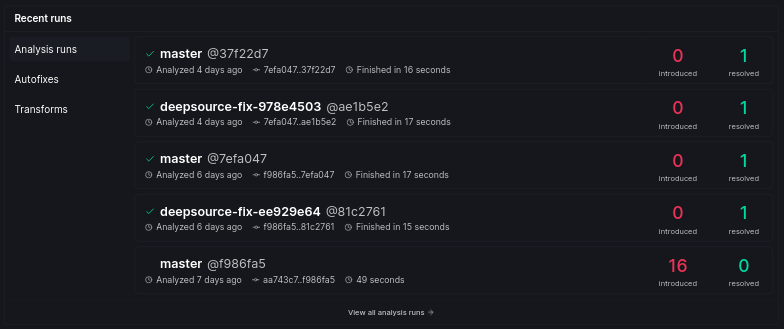
The Recent runs tab shows the 5 most recent Analysis runs, Autofixes and Transforms on your repo. Additionally, it also shows some details about each run, such as newly introduced or resolved issues from that run.
You can click on the View all analysis runs button at the bottom of Recent runs section to see the full History of analysis runs.
The Issues tab
Issues are the real deal when it comes to the analysis results. They are the actual vulnerabilities and problems you should pay attention to in your code-base. The Issues tab is the place where you get detailed information about all the issues detected from DeepSource analyses. It is updated after each new analysis run.
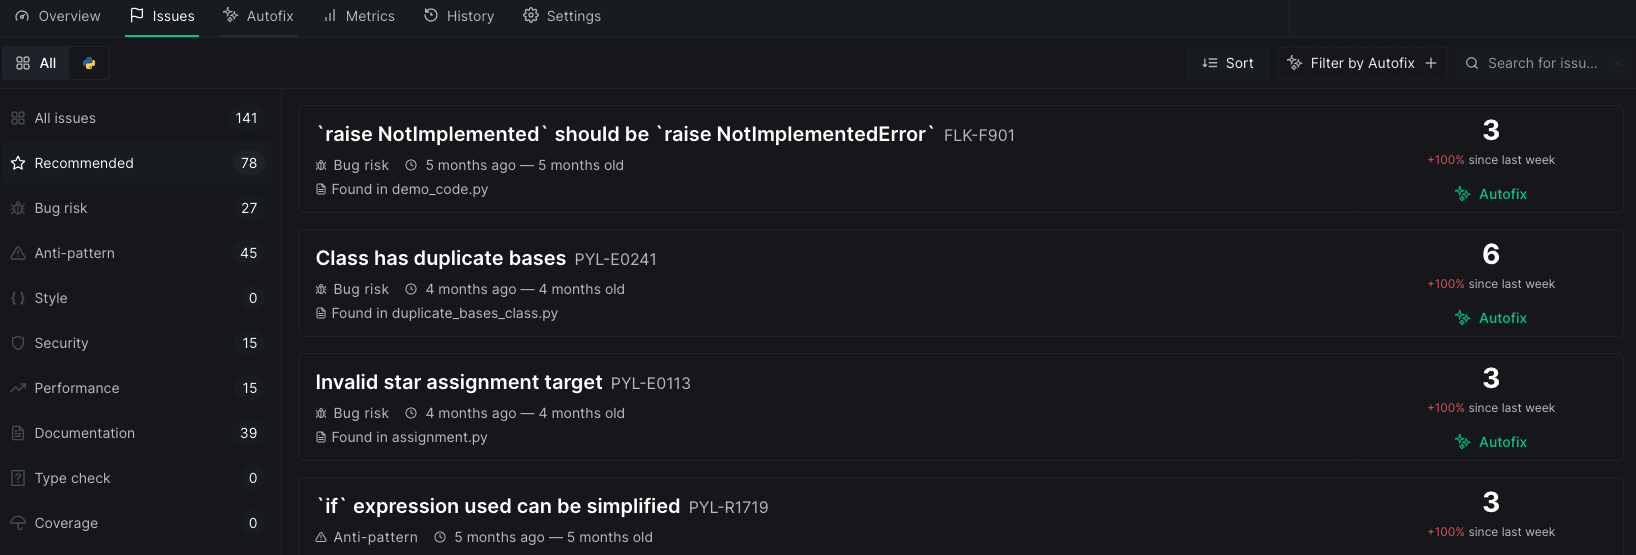
Since the number of issues detected in some repositories could be pretty high, it's important for us to make them easily manageable. You can filter, sort or search for issues based on various criteria:
Filter by language
Filtering issues by programming language can be helpful if you have a multilingual project on your hands.
You can choose to display issues of all languages (by choosing the All option), or just one by choosing the icon of that language.
Filter by issue category
All the issues detected by DeepSource are divided into several issue categories. To only see the issues of a particular category, just select the one that you're concerned about from the list of categories. This list also shows the number of issues detected in each category to help you determine the type of issue that needs the most work.
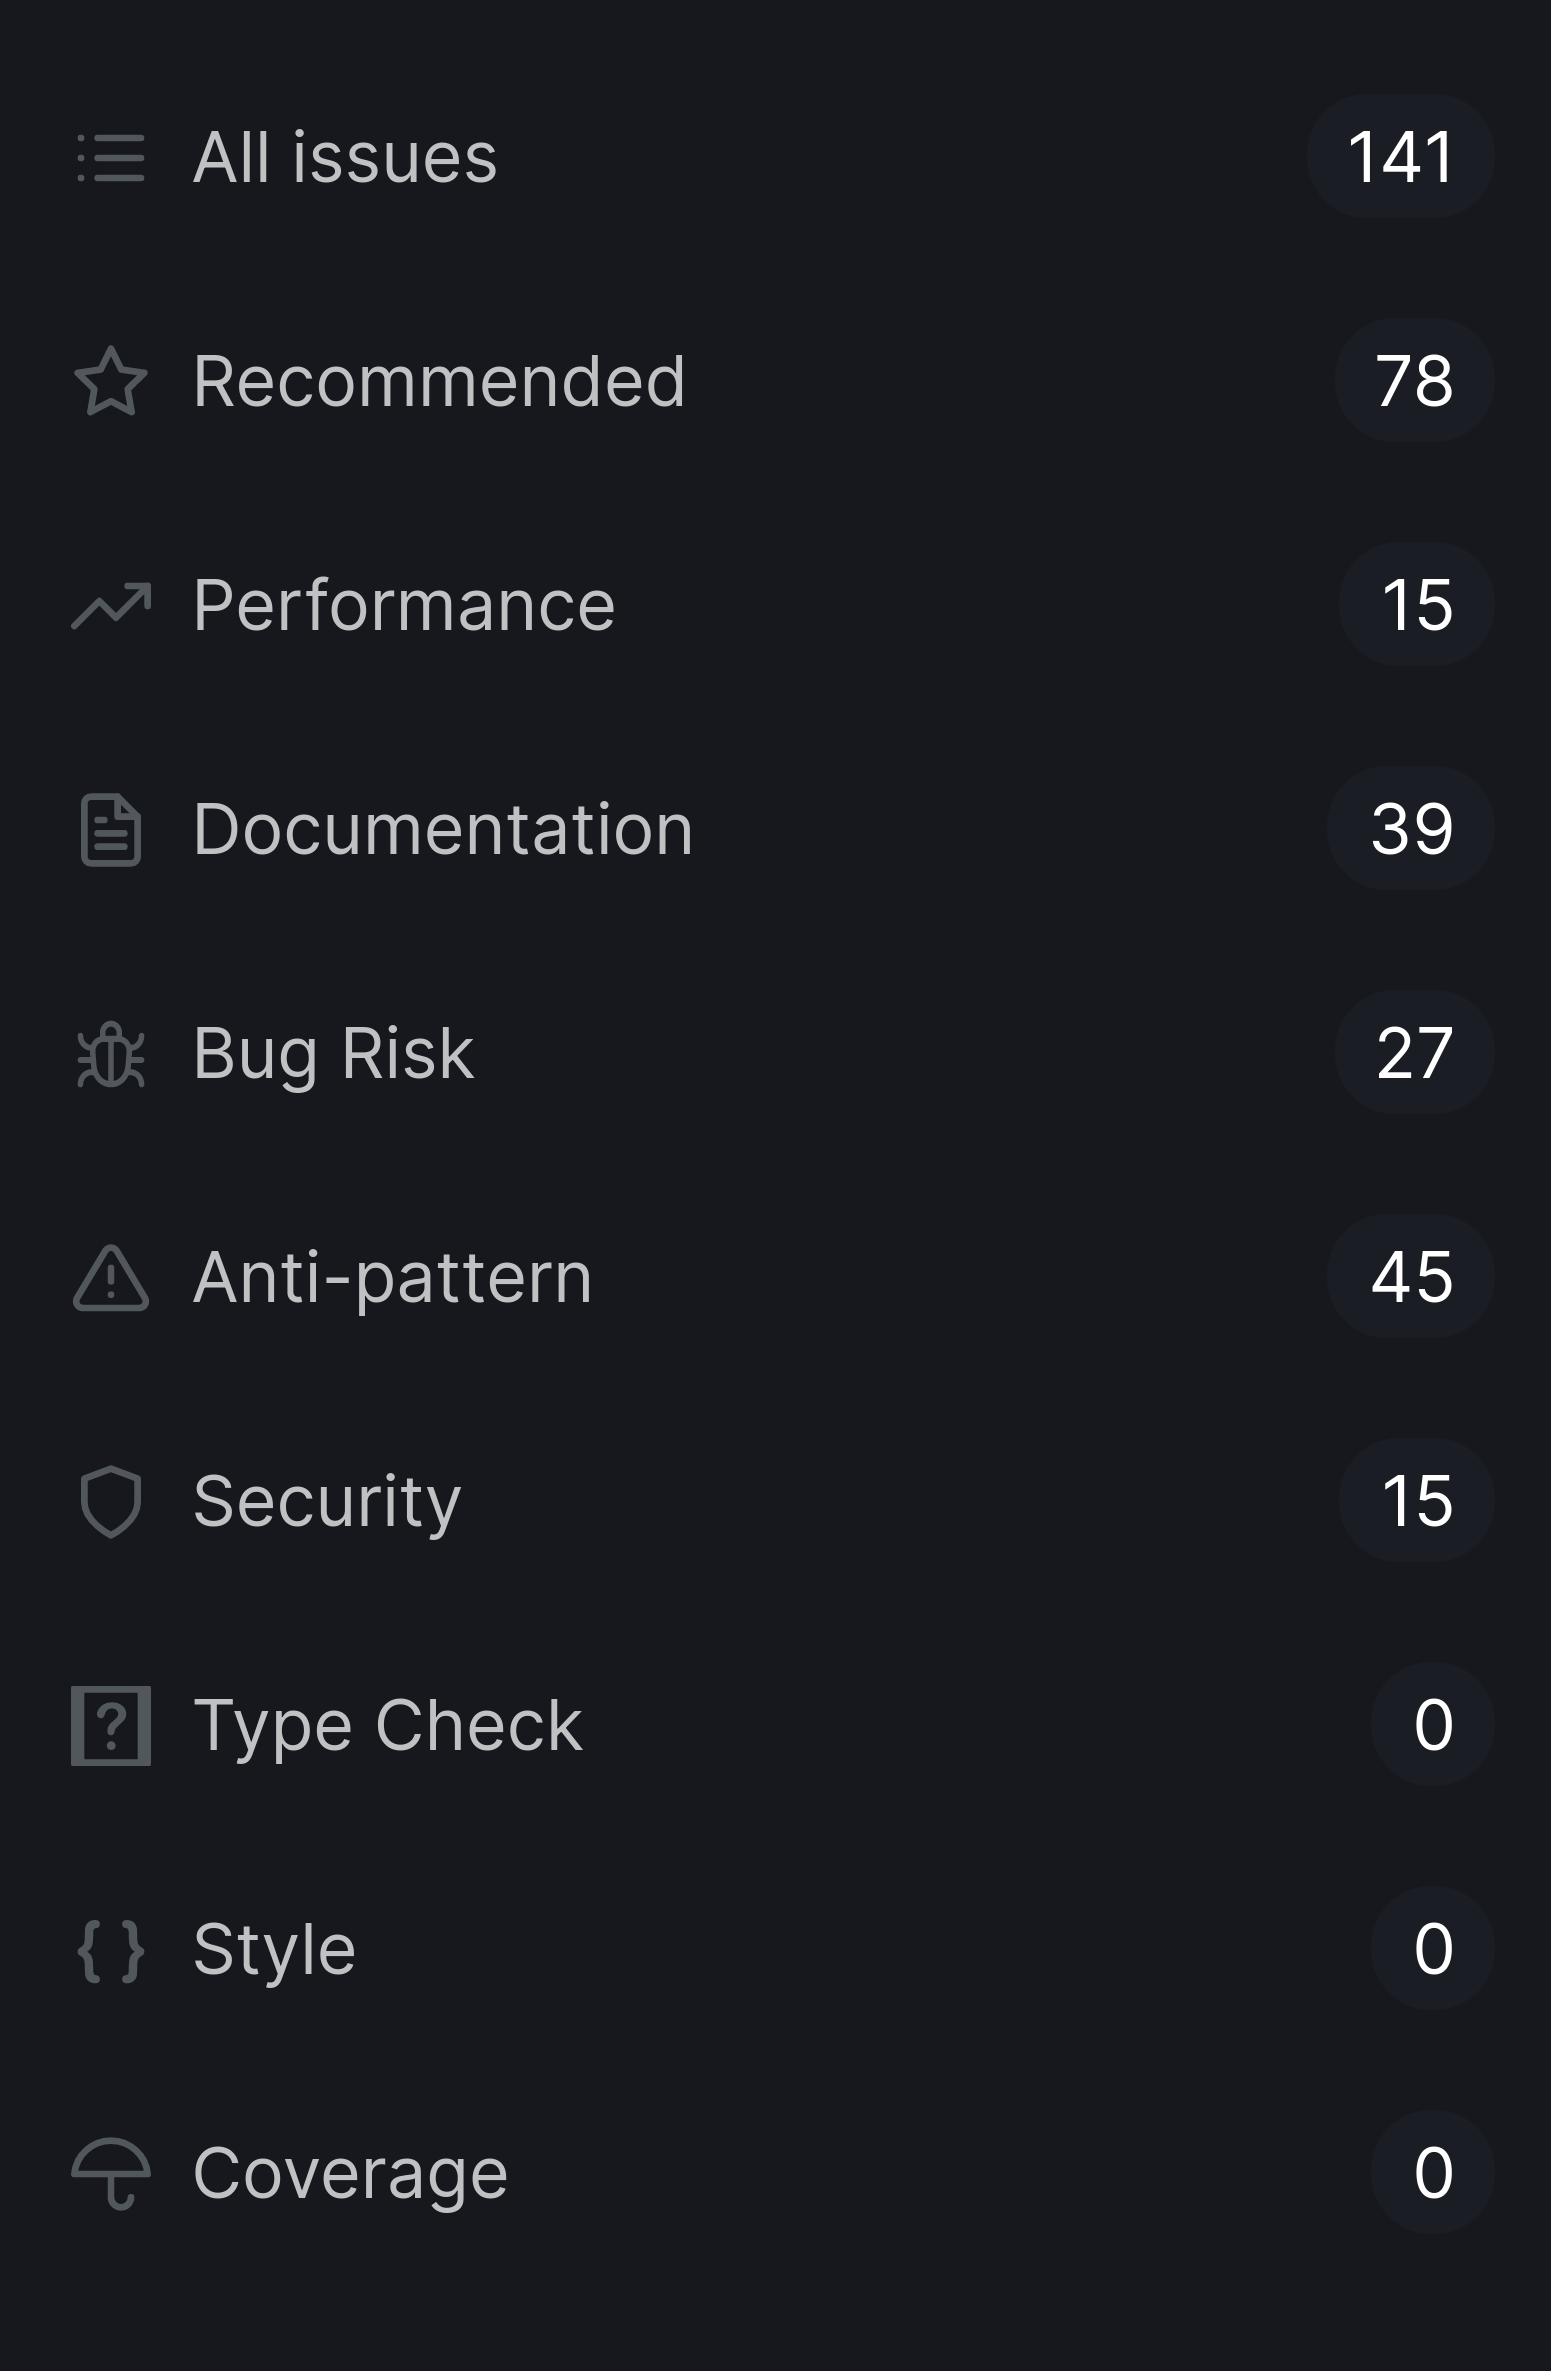
This is particularly helpful when you want to focus on one aspect of the code at a time. For example, you may want to prioritize fixing the Performance issues in your code urgently.
Sorting issues
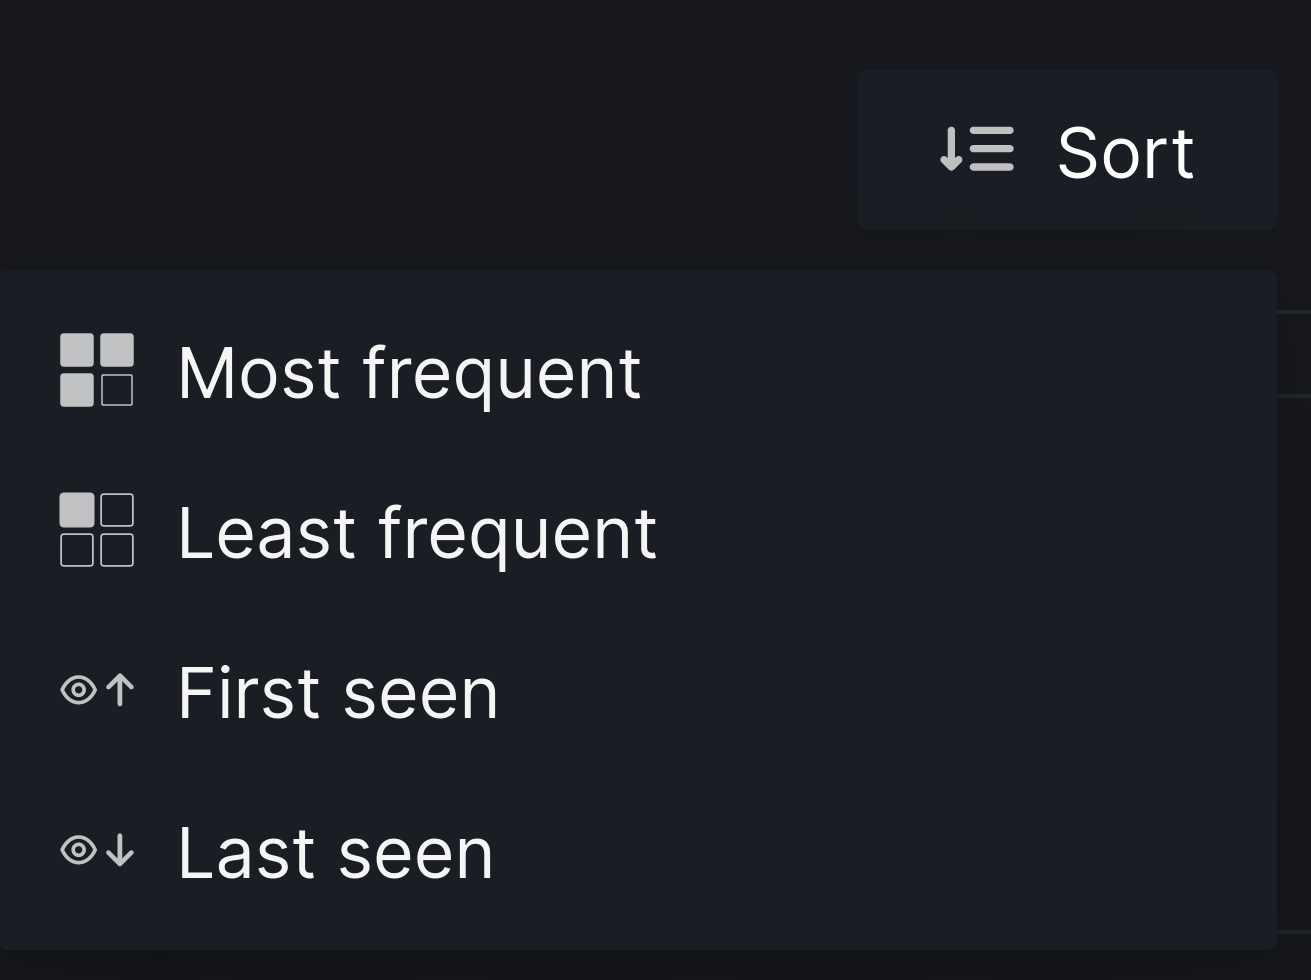
You can sort the order of the displayed issues with the following options:
- Most frequent: Sort in decreasing order of the number of occurrences of an issue (issues with the most occurrences appear first).
- Least frequent: Sort in increasing order of the number of occurrences of an issue (issues with the least occurrences appear first).
- First seen: Show the oldest detected issues first.
- Last seen: Show the newly detected issues first.
To clear sorting preferences, just click on the Sort button again.
Any filters that you applied will still be applicable if you sort the issues
Filter by Autofix
Sometimes you might want to hurry things up and get rid of a few issues quickly by using our Autofix feature (Hint: that's exactly what Autofix is for!).

Instead of looking around for issues that have an Autofix available, you can directly filter them out by selecting the Filter by Autofix option. While it's active, it'll have a green indicator.

Search for a particular issue
If you have a particular issue in mind to fix, finding it quickly using the Search bar is your best option.
The Search bar can be used to look for specific issues based on:
- Keywords from the issue title
- A filename (all the issues present in that file will be displayed)
- Some code present in the issue

Once you start using DeepSource on a regular basis, you'll get familiar with the issue titles, and searching them would be really convenient
Ignore issue
There can be several reasons why you would want to ignore an issue and prevent it from popping in the Issues tab after every analysis. Some of the obvious reasons are:
- The issue is intentional or irrelevant
- The team don't want to fix the issue in the immediate future
- The issue is a false-positive
Let's take a look at the ways to ignore an issue:
Ignore issues in file(s)
- On the issue description page, click on the 'Ignore this issue' button on the top right corner
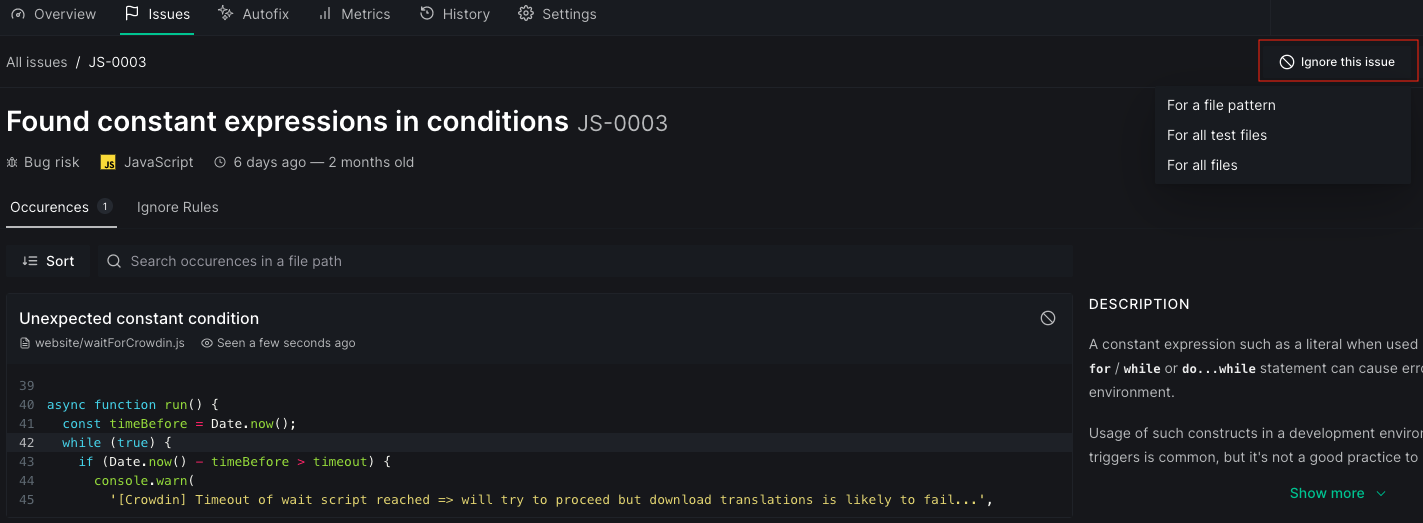
- You'll see the three options for ignoring an issue
For a file pattern: You would want to ignore an issue for files that match a pattern: say you don’t care about documentation issues in an internal package — all files matching
contrib/utils/*.py. You can now ignore the issue for a specific pattern by clicking Ignore this issue → For a file pattern, and then entering the file pattern. All occurrences of this issue that match the file pattern provided will be removed, and the rule will take into effect from the subsequent analysis.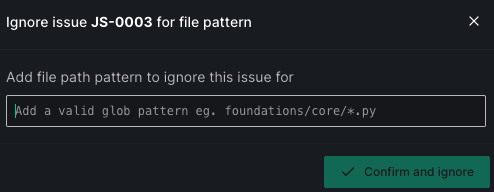
For all test files: If the test patterns are specified in the
.deepsource.tomlfile, DeepSource will use this information to filter out a number of issues that don’t make sense in test files, but do so in the application code. You can ignore an issue for all the test files in the repository. Click Ignore this issue → For all test files This will remove all occurrences of an issue in the specified test files.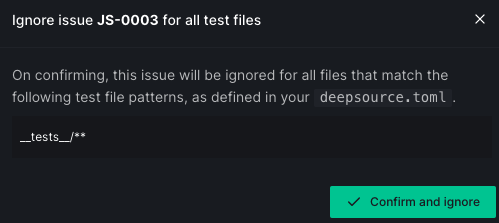
If there are no test patterns specified in the
.deepsource.tomlfile, you'll get the following prompt: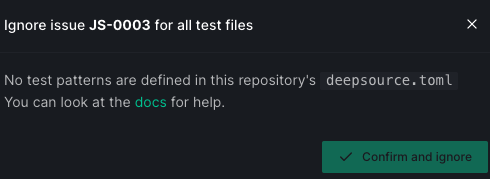
For all files: If you decide you don’t particularly care about an issue, you can ignore it for all files in the repository. Click Ignore this issue → For all files. This will remove all occurrences of an issue in the repository, and ignore the issue from the subsequent analysis.
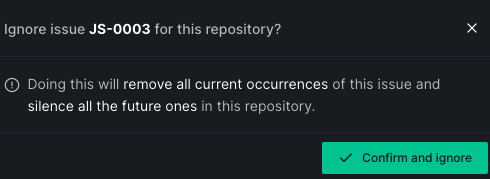
Ignore occurrence of an issue
On the issue description page, click on the ban button on the top right corner of a particular occurrence of an issue. You'll see the following menu:
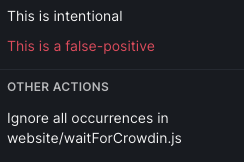
You can ignore a particular occurrence of an issue if you think that is intentional. To permanently silence an issue, you can use
skipcqrule, read more about it here.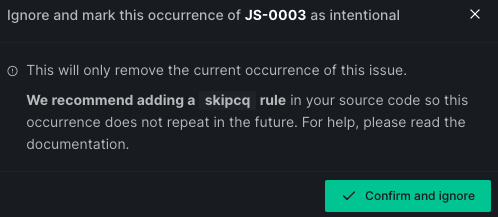
Ignore an issue if you think it is a false-positive.
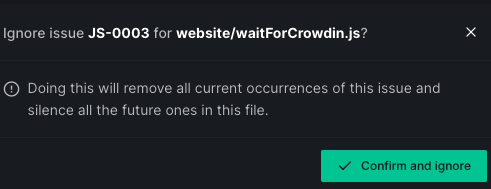
If there are multiple occurrences of an issue in a file that you want to ignore, you choose the last option to ignore all the occurrences.
See also
Suppress metric
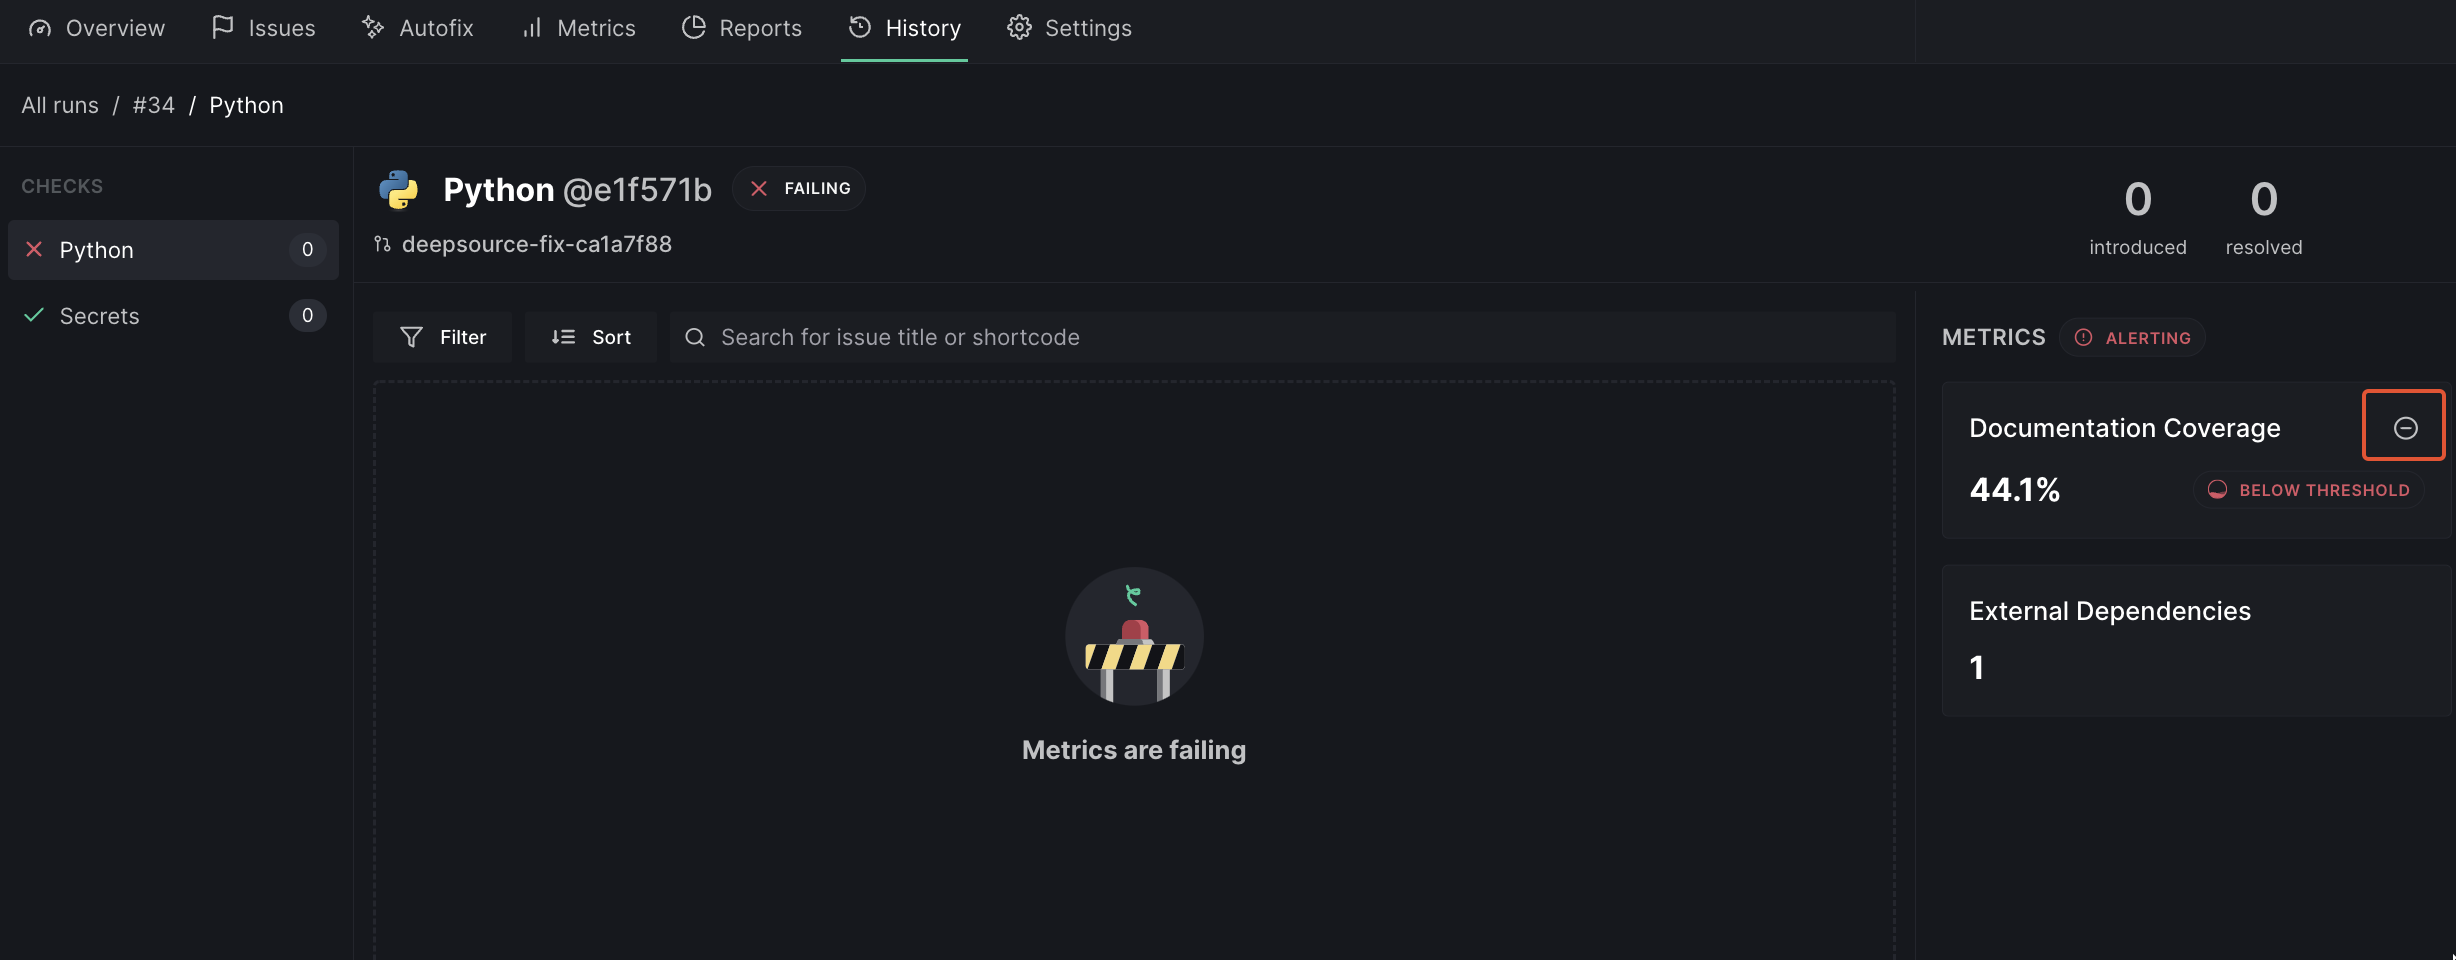
After setting threshold for a metric and enabling threshold enforcement in the repository settings, subsequent pull request runs will start failing if the threshold conditions are not met. However, you can choose to suppress a metric from the Run page which will unblock the pull request on your VCS provider.
False-positive
A false-positive is an issue detected by DeepSource that is simply invalid or incorrect. False-positive issues are detected due to the flawed detection logic. In most cases, if an issue is flagged incorrectly, it's because of the limitations of the analyzer. If you come across one in your codebase, you should report it. This will remove the occurrence of that issue, and also notify our engineering team, who can incorporate this feedback into making analyzers more reliable, and less noisy.
Reporting a false-positive
If you believe you've come across a false-positive, you can report it directly from the dashboard:
- To ignore a particular occurrence of an issue, click on the ban button on the top right corner of that occurrence and select 'This is a false-positive' from the menu

- A pop-up window appears with a text box where you have to option to enter the details about the false-positive; click on the 'Confirm and ignore' button to submit the report
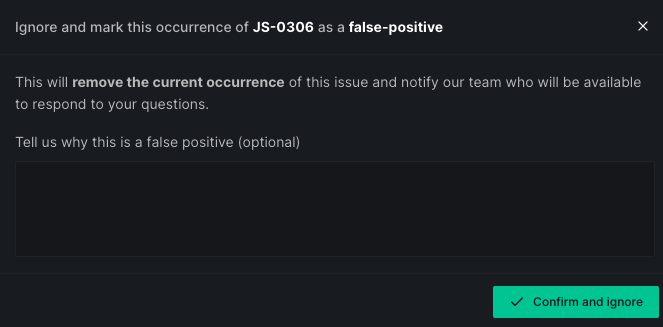
Every false-positive report is sent directly to our engineering team, and they reach out to the reporter at the earliest regarding the false-positive.
The Autofix tab
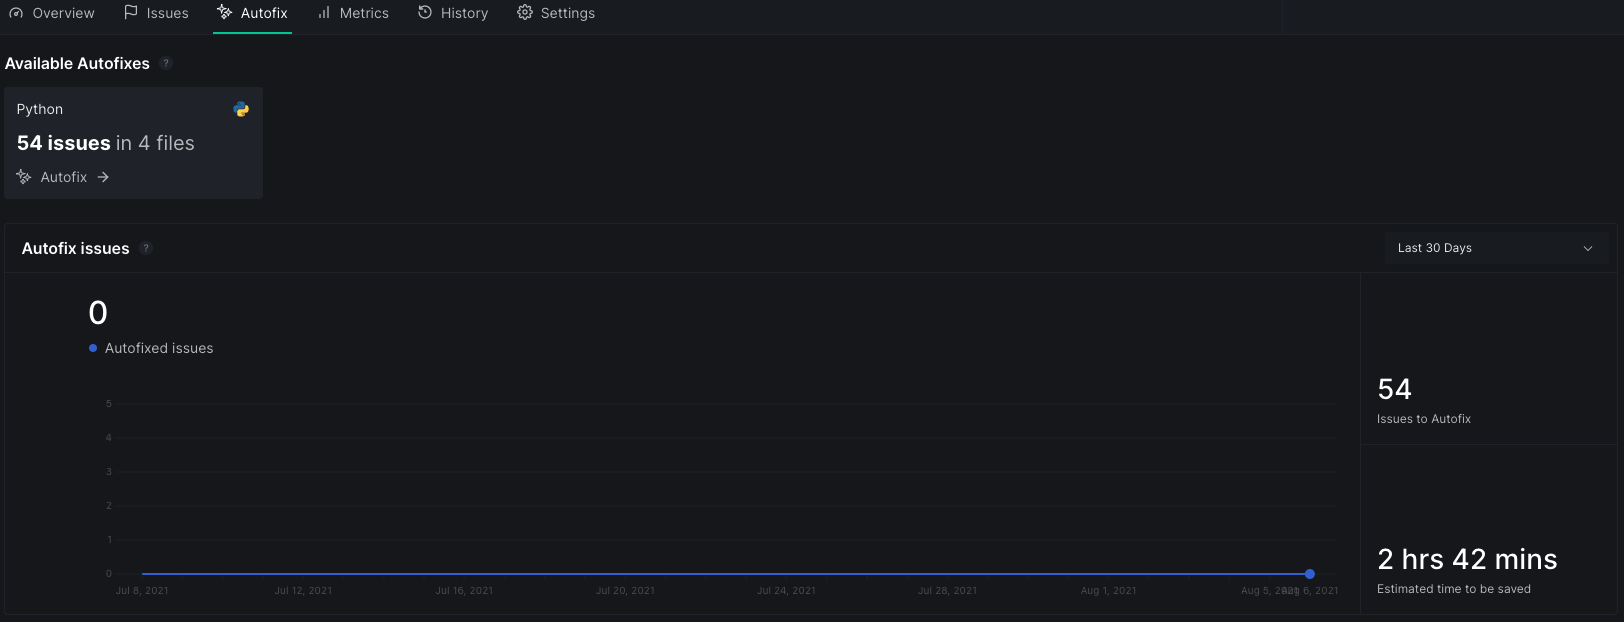
The Autofix tab, as the name suggests, contains your Autofix usage stats and recent Autofix usage trends.
You cannot directly Autofix issues from this tab.
Available Autofixes
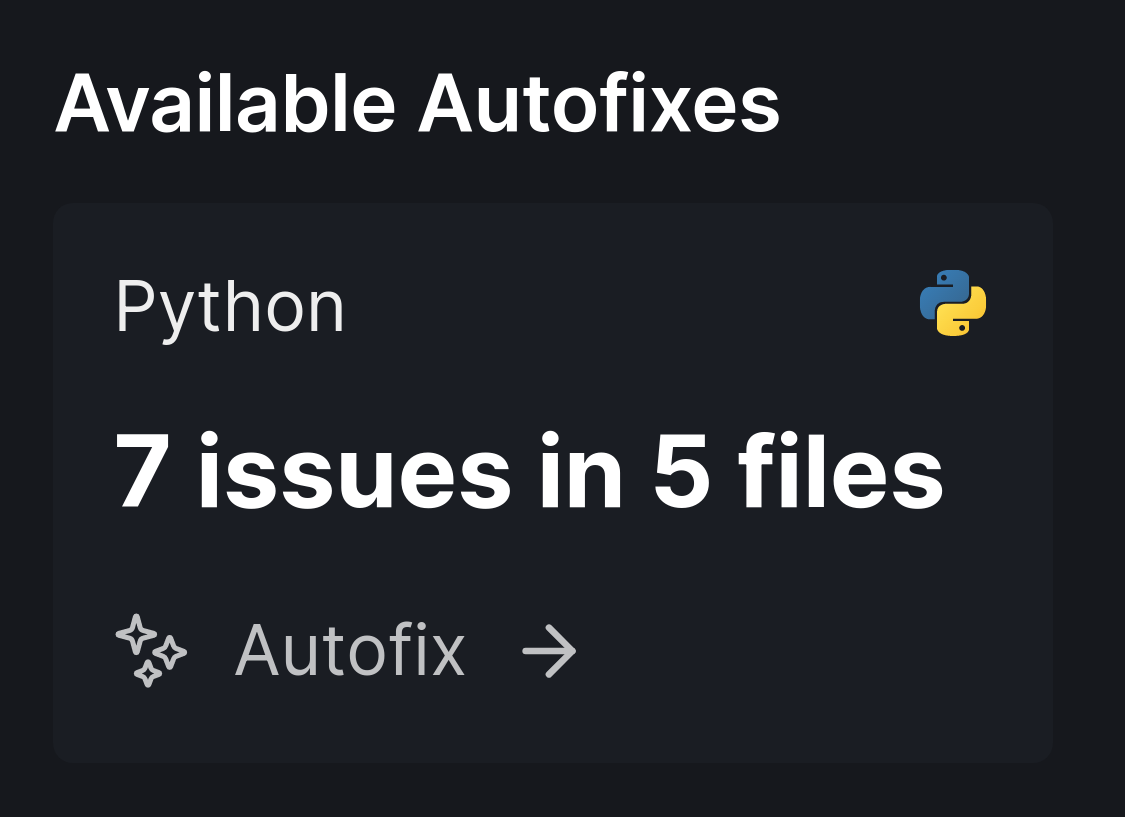
The Available Autofixes section shows you a count of the issues you can Autofix, grouped by languages, and the number of files that'll be affected by all those fixes. Clicking on any of the language buttons will take you to the Issues tab and show you issues for that language. From there, you can use the Autofix feature to open PRs with the fixes.
Autofix stats

These statistics are a collection of your Autofix usage trends over time.
The graph
- The graph is a plot of the number of issues you have Autofixed with time.
- On hovering over the plot, you can see the exact number of issues Autofixed on a particular day.
Issues to Autofix
This is a count of the total number of issues that you still need to Autofix all over the code-base for all languages.
Estimated time to be saved
The estimated time to be saved is an aggregate of how much time you can potentially save by using all the available Autofixes instead of fixing them manually.
This is calculated by an estimate of how much time it could possibly take to detect and fix each occurrence of an issue. There are several factors like complexity of the issue, length of the file, etc. taken into account for this estimate.
Recent Autofixes

The Recent Autofixes section shows the 5 most recently Autofixed issues and the number of occurrences fixed for that issue.
The Metrics tab
While talking of code quality, it's not just limited to the actual issues directly found in your source code. There are a lot of hidden stats and figures that majorly affect how your code performs, and how much it is accessible to other developers.
DeepSource analysis, in addition to pointing out the direct code-specific issues in your code-base, also calculates some key metrics that determine various aspects of your code's quality. The Metrics tab is the place where all these numbers are crunched down and displayed.
Available metrics
| Code | Name | Description |
|---|---|---|
| LCV | Line Coverage | Line coverage of the default branch of the repository |
| NLCV | New Line Coverage | Line coverage of new code added in a pull request |
| BCV | Branch Coverage | Branch coverage of the default branch of the repository |
| DCV | Documentation Coverage | Track the extent to which your application code is documented |
| DDP | External Dependencies | Total number of 3rd-party dependencies used in this repository |
Metric chart
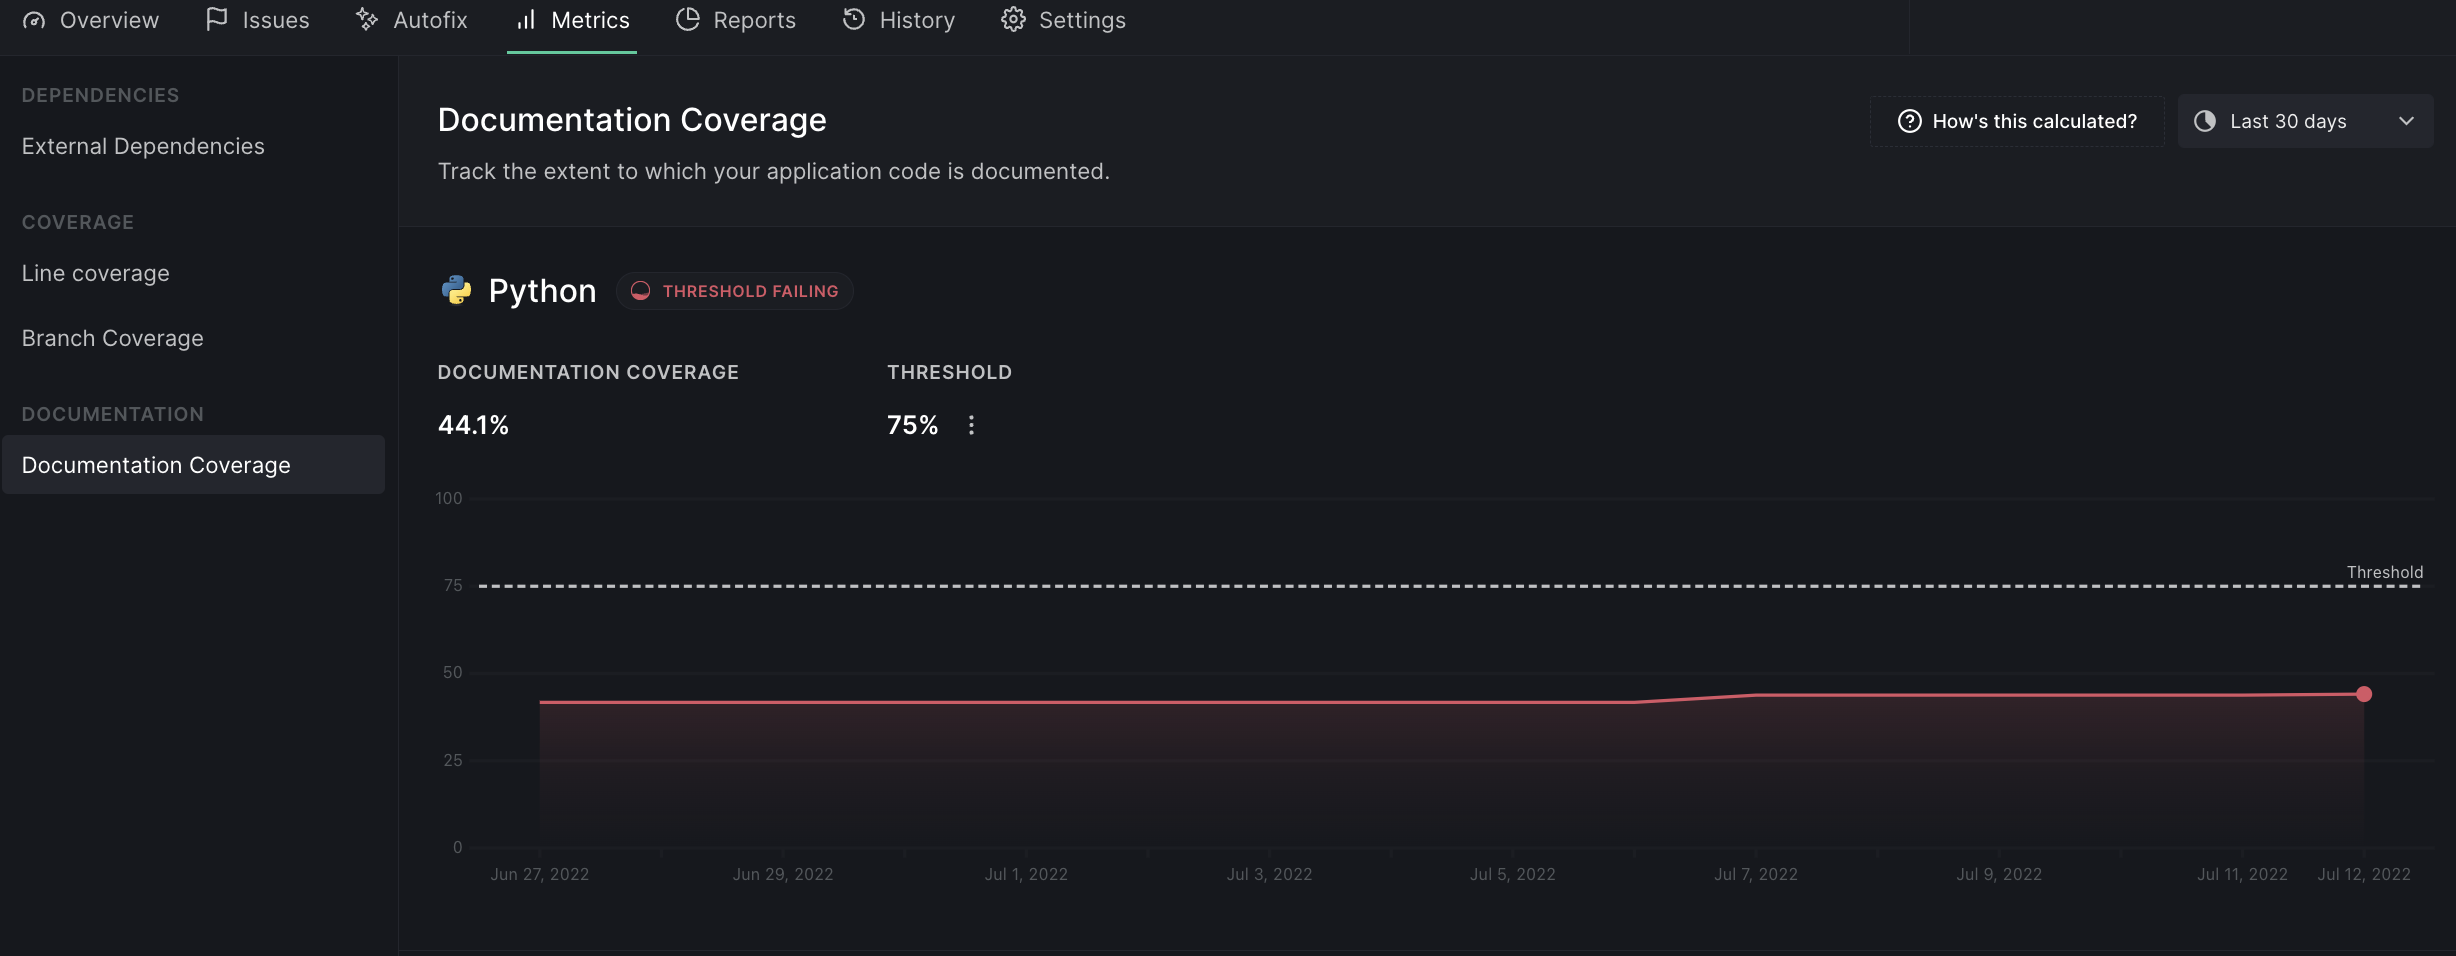
Metrics are reported as a trend line across time, the chart shows how that metric has changed over time and if they are above or below the threshold. These metrics are reported per analyzer, some metrics also include an aggregate across the analyzers using aggregation logic mentioned later in the documentation.
- On selecting a particular metric, you'll see the plot of the variations in the metric's values.
- You can set the duration of the stats to be displayed to 30, 60 or 90 days.
- You can update the allowed threshold value for each metric, or remove the threshold altogether by clicking on the options icon next to where the currently set value is displayed.
Metric aggregate calculation
When a particular metric is captured for multiple languages, an aggregate is also calculated for it. Each metric will have either one of the following three aggregate logics:
| Type | Used by | Description |
|---|---|---|
| Sum | External Dependencies | Calculated as a summation of the metric's values captured for all languages reported in an Analysis run |
| Average | Documentation Coverage | Calculated as an arithemetic mean of the metric's values captured for all languages reported in an Analysis run |
| Weighted Average | Line Coverage, Branch Coverage | Calculated as a weighted arithemetic mean of the metric's values captured for all languages reported in an Analysis run but taking into account each language's weight fraction in the repository |
The History tab
This is where you can track all the actions taken by DeepSource on your code-base. This includes the complete history of all the analysis and transformations.
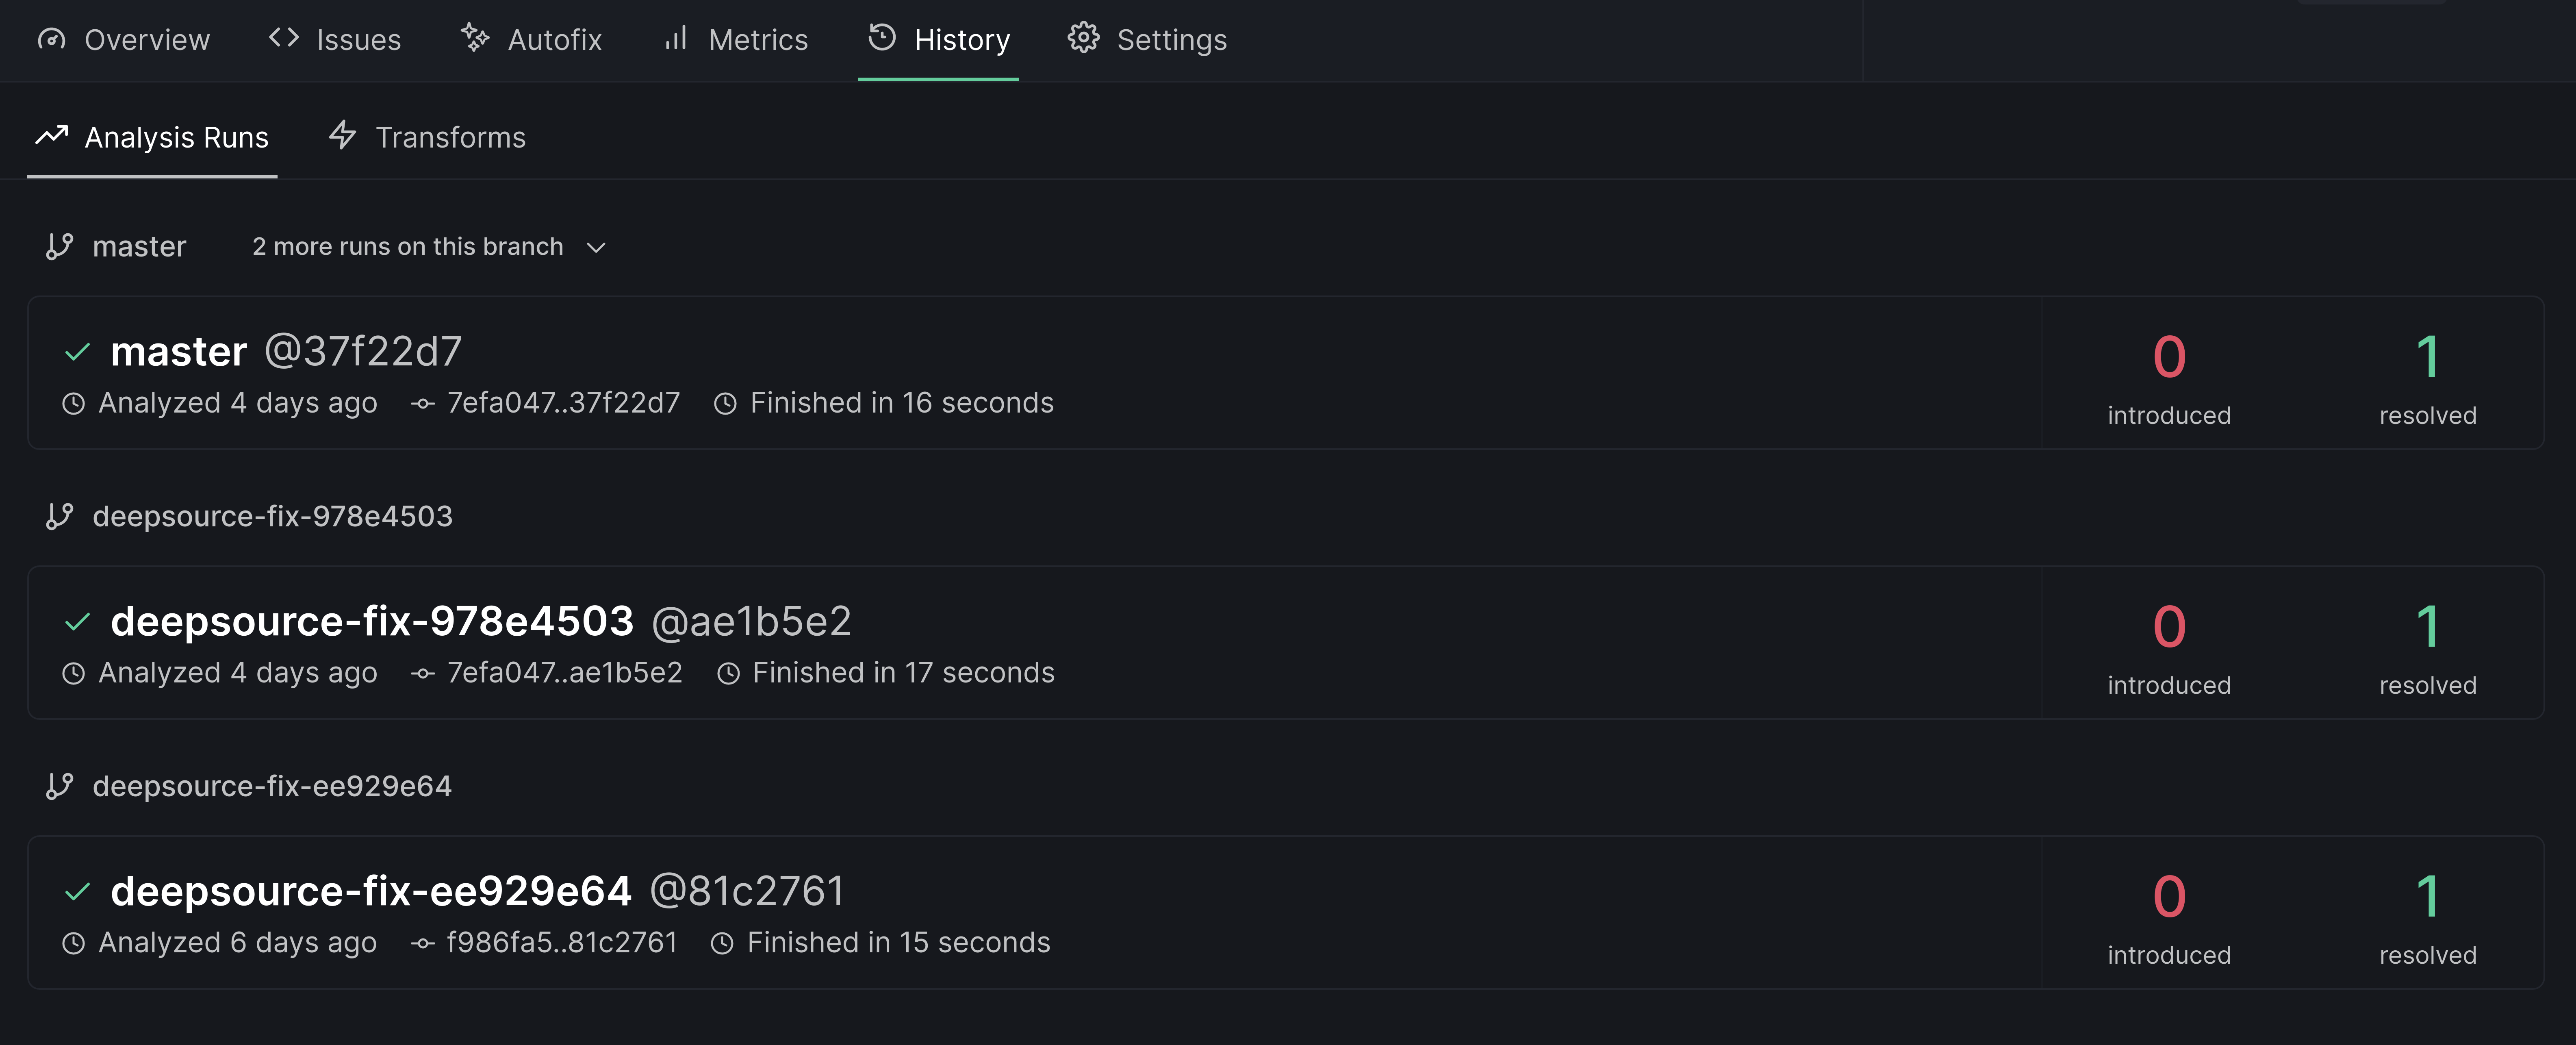
Each entry shows the affected branch, the latest commit analyzed and the duration that the analysis ran for. It also shows the number of newly introduced issues and the issues resolved from the last run.
An Autofix session also triggers an analysis run on the temporary branch created for the PR
You can see details of a particular run by clicking on it.
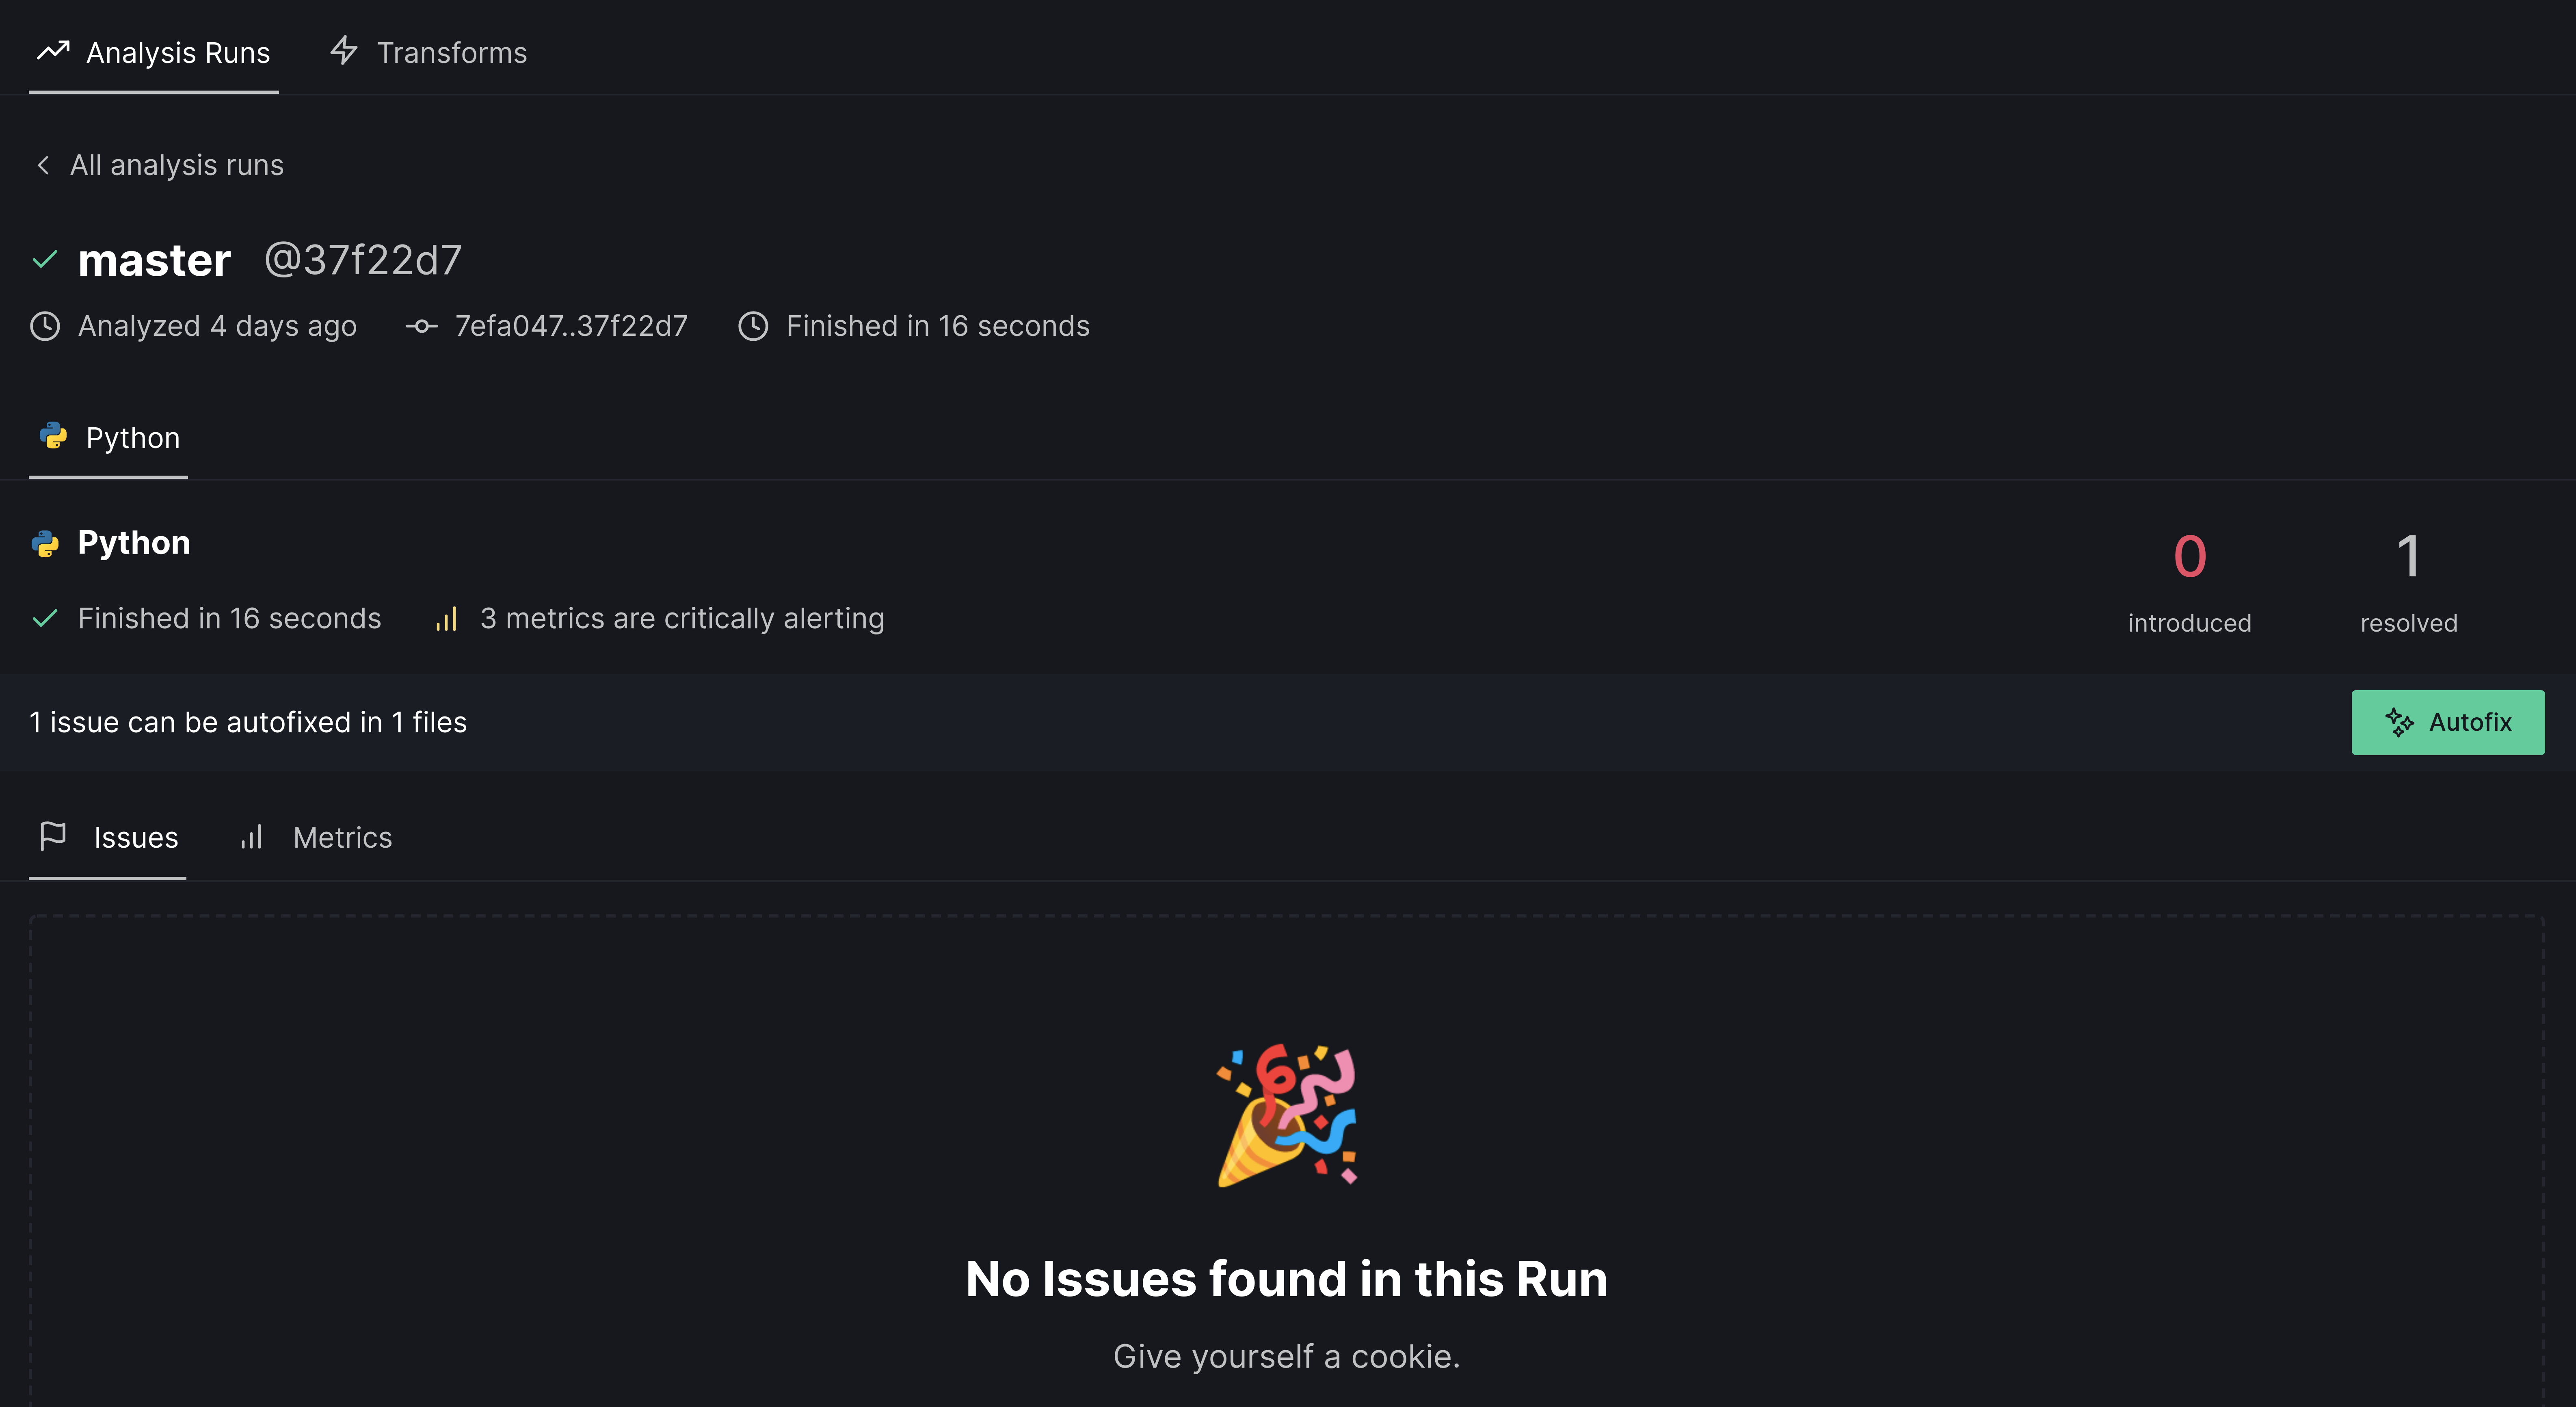
These records of previous analysis runs are like logs, and it is important to have them available to you. You might need to revisit this history for various reasons.
The Settings tab

There are a lot of tweaks you can make to have your analysis tailor-made for a particular project.
You can head to the Settings tab to configure your analysis specifically to that repository. Details about the specific settings can be found at the Repository settings page.